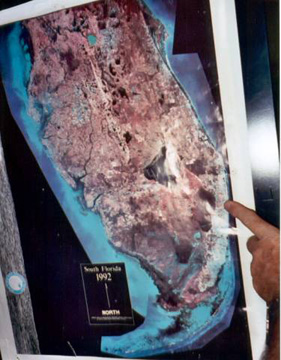
Fig. 1: Satellite view of southern Florida (ex. SFWMD)
The laboratory is located in room 123 of the Science and Engineering Building on the north side of the main (see finger on figure below) campus (Boca Raton) of Florida Atlantic University.
Note the proximity to the Atlantic Ocean, Lake Okeechobee, the Everglades, Florida Bay and the Gulf of Mexico.
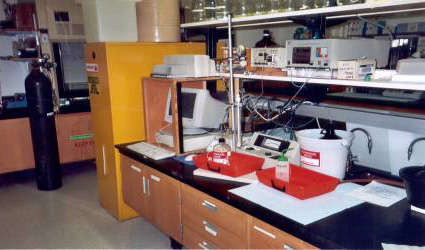
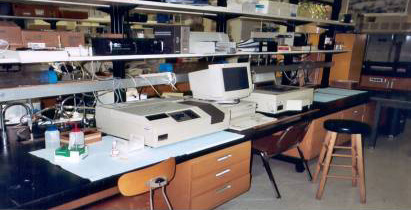
Upon entering the lab, we find a bit of shared equipment. This includes a Mattson Galaxy FTIR, a Perkin-Elmer Series 400 quaternary HPLC and (out of sight to the right) a SEC (GPC) system with ternary pump, UV and light scattering detectors.
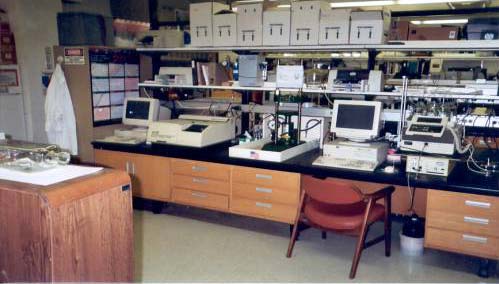
On the opposite side of the bench in Figure 2 is located my gas chromatograph (Perkin-Elmer Sigma 2000) which we use for the analysis of fatty acids, as their methyl esters (FAME), cleaved from natural carotenyl esters or isolated from water / sediment samples. Additionally, after changing the capillary column, we also analyze geochemical arrays of hydrocarbons (saturates, olefins, etc.).
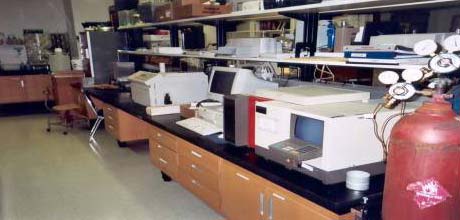
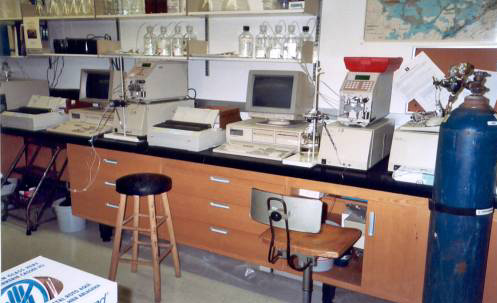
Farther down the bench (light grey) is the Dohrman Mdl. DC-190 carbon analyzer used for determining organic carbon contents of various samples.
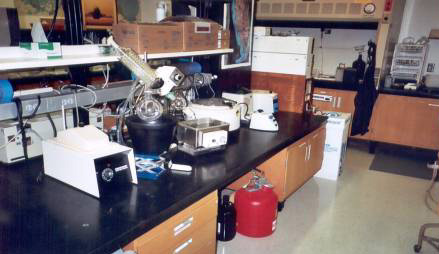
Across the aisle from the carbon analyzer is located an area for the centrifugation, heating, or rotary evaporation of samples. In the upper left of this figure (Fig.4) is one of the most important areas of any laboratory- the dish washing station.
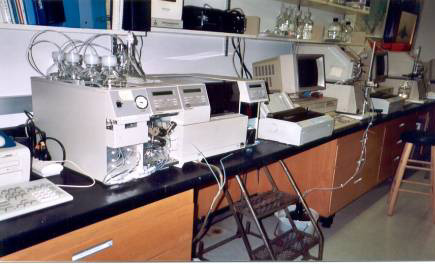
To the right of the equipment in Figure 4 is a Low Pressure High Performance Liquid Chromatography System (LP-HPLC: Fig. 5). This system uses an ISCO ternary gradient mixer with a Knauer HPLC pump for the separation / purification of larger (100 mg 1mg) quantities of pigments to be used as knowns in true HPLC. Detection is simple in that the eluate flows through a micro-flow cell in a Spectronic-20 colorimeter (typically at 430nm) with the signal being passed to a PC operating a PeakSimple data system.
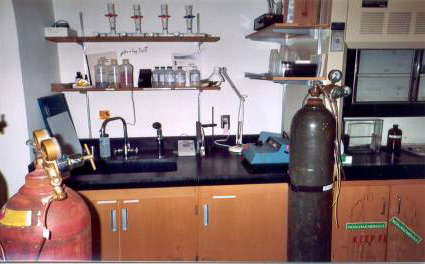
This area (Fig. 6) is utilized for the determination of several bulk water parameters including pH, turbidity, and conductivity, ORP (oxidation-reduction potential.
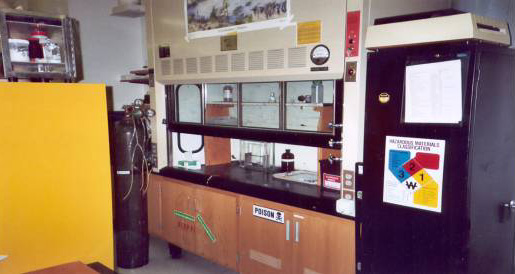
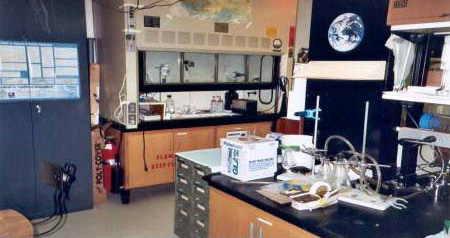
The laboratory has 2 large fume (exhaust) hoods. The one shown below (Figure 7) is used primarily for wet chemistry. That is, we routinely need to generate known compounds for comparison the myriad of unknown carotenoids and chlorophyll-derivatives encountered in our studies, both environmental and geochemical. Thus, this is where partial syntheses and numerous derivatizations (reductions, oxidations {not all planned!}, esterifications, deesterifications, etc.) occur.
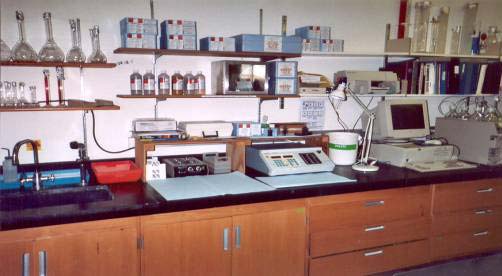
The area shown below (Figure 8) is utilized for water analyses. This includes macro-nutrients (N as ammonia, nitrite, nitrate; P as SRP {Soluble Reactive Phosphorous} and acid-hydrolyzable P, both as ortho-phosphate, certain micro-nutrients (iron, silicate, sulfur {sulfate}*) and selected bulk parameters (COD {Chemical Oxygen Demand}). Sulfate is also important in providing an oxidant as waters become suboxic to anoxic.
The other fume hood is on the opposite of the lab and is dedicated to the extraction of pigments and other organics from natural samples (seston, sediment traps, senescent cultures, viable cultures, etc.). This keeps synthetic and analytical functions well separated in space and minimizes cross-contamination.
The heart of any pigment laboratory is the spectrometers. Here (Figure 10) is shown my Perkin-Elmer Lambda-2 ultraviolet-visible (UV/Vis) spectrophotometer and Perkin-Elmer LS-3 spectrofluorimeter. These are used for initial scans of extracts, and the estimation of total chlorophyll(s) by absorption and fluorescent techniques. The fluorimeter is set to a bandwidth of 5nm, allowing the Welschmeyer method of chlorophyll determination without the need for an acidification (pheophytinization) step.
A co-owned Perkin-Elmer LS-50B is in the adjacent laboratory of Dr. Predrag Cudic and is available on an unlimited basis for spectrofluorimetry.
If the spectrometers are the heart of a pigment lab, then the high performance liquid chromatographs (HPLC) form the brains. Figure 11 is a view of the 2 matching quaternary (TSP Mdl. 4100 pumps) HPLC systems with Waters Model 990 PhotoDiodeArray (PDA) detectors. These systems use an octyldecylsilane (ODS, C-18) column (left hand unit) for complete pigment analyses or an octyl (C-8) column for the separation of the divinyl analogs of chlorophylls-a and b so important in the identification / quantification of members of the Prochlorophyta.
Both of these systems provide full spectral (190 800nm, 330-800nm typical) data acquisition. It is the 2-dimensional data (retention time plus absorption spectrum) which provides the basis for the identification of the chlorophylls, chlorophyll derivatives and carotenoids that we analyze. Standardization of such systems requires a great number of known pigments. Our laboratory has accumulated many knowns about 18 of which could be obtained by purchase or as gifts. Numerous others (>100) were generated by partial syntheses and derivations (See Louda et al. 2002: Org. Geochem. Vol. 33, pp. 1635 1653), a process which continues.
Analyses of related samples and increased sample throughput is achieved using the SpectraPhysics SpectraSystem automated HPLC system. Here an autosampler with a Peltier device for chilling samples, a quaternary HPLC pump and single wavelength monitoring system allow for the analysis of larger sample suites. This system runs the UNESCO developed separation scheme (see Jeffrey et al., 1997. Phytoplankton Pigments in Oceanography. UNESCO Publishing, Paris, 661pp.) and PeakSimple in Windows for data acquisition.
The front of the lab is devoted (Figs. 13-14) to student desks (carrels), one of which (Figure 13) is currently being utilized as a microscopy station.
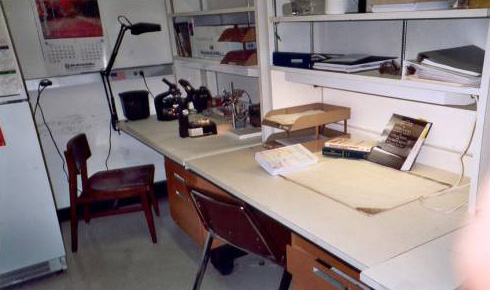
Fig. 13: Student carrel and microscopy station (compound and dissection microscopes).
Epifluoresence is performed in another laboratory, with unlimited access.
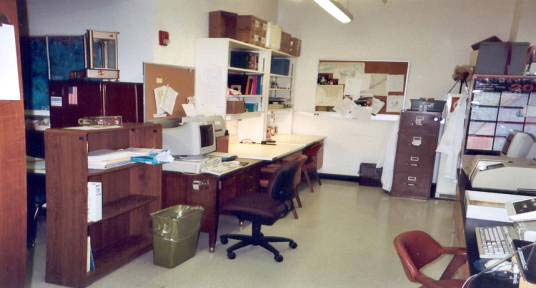
Fig. 14: Student desk area showing one of the 2 web linked PCs for student use.
Literature searches (SUS links, SciFinder etc.), structure drawing (ChemDraw)
and other software loaded.
I hope that you have enjoyed the pictorial tour of my lab. I will be very glad to give personal guided tours and to discuss joint research projects including, most importantly to the Universitys mission, those with prospective graduate students.
Return to Dr. Louda's Home Page, Chemistry Faculty Page or the Chemistry Home Page.